Making Verification Visible
A pass or fail line at the end of a turn is not enough to trust an agent's build. A tour of GuardianKane's dashboard: the code, memory, and PRD graphs, the Kane activity feed, a chat panel wired into the live Claude Code session through an undocumented socket, and the bugs the dashboard exposed in the gate itself.
The hackathon gate had one output: a line in the terminal saying a task passed, failed, or needed a human. That line is honest, but it is small. It does not tell you what the agent touched, which requirements have a test behind them, which of those tests have ever passed in a browser, or why a task has been blocked since last night.
The rebuild's answer was a dashboard, and it is the part people miss when they hear GuardianKane described as a Stop hook. This is a tour of it, using screenshots from the ecommerce demo, a real project built through the loop and committed with its unedited history. Part 1 covers how the system got here.
Four tabs
The dashboard runs at localhost:4173 and has four tabs: Code graph, Memory
graph, PRD graph, and Kane activity. An "Ask GuardianKane" chat panel sits on
the right of every tab. The graphs are drawn with cytoscape; the panels poll small JSON
files that the hooks and the graph build write into .testmuai/.
Code graph
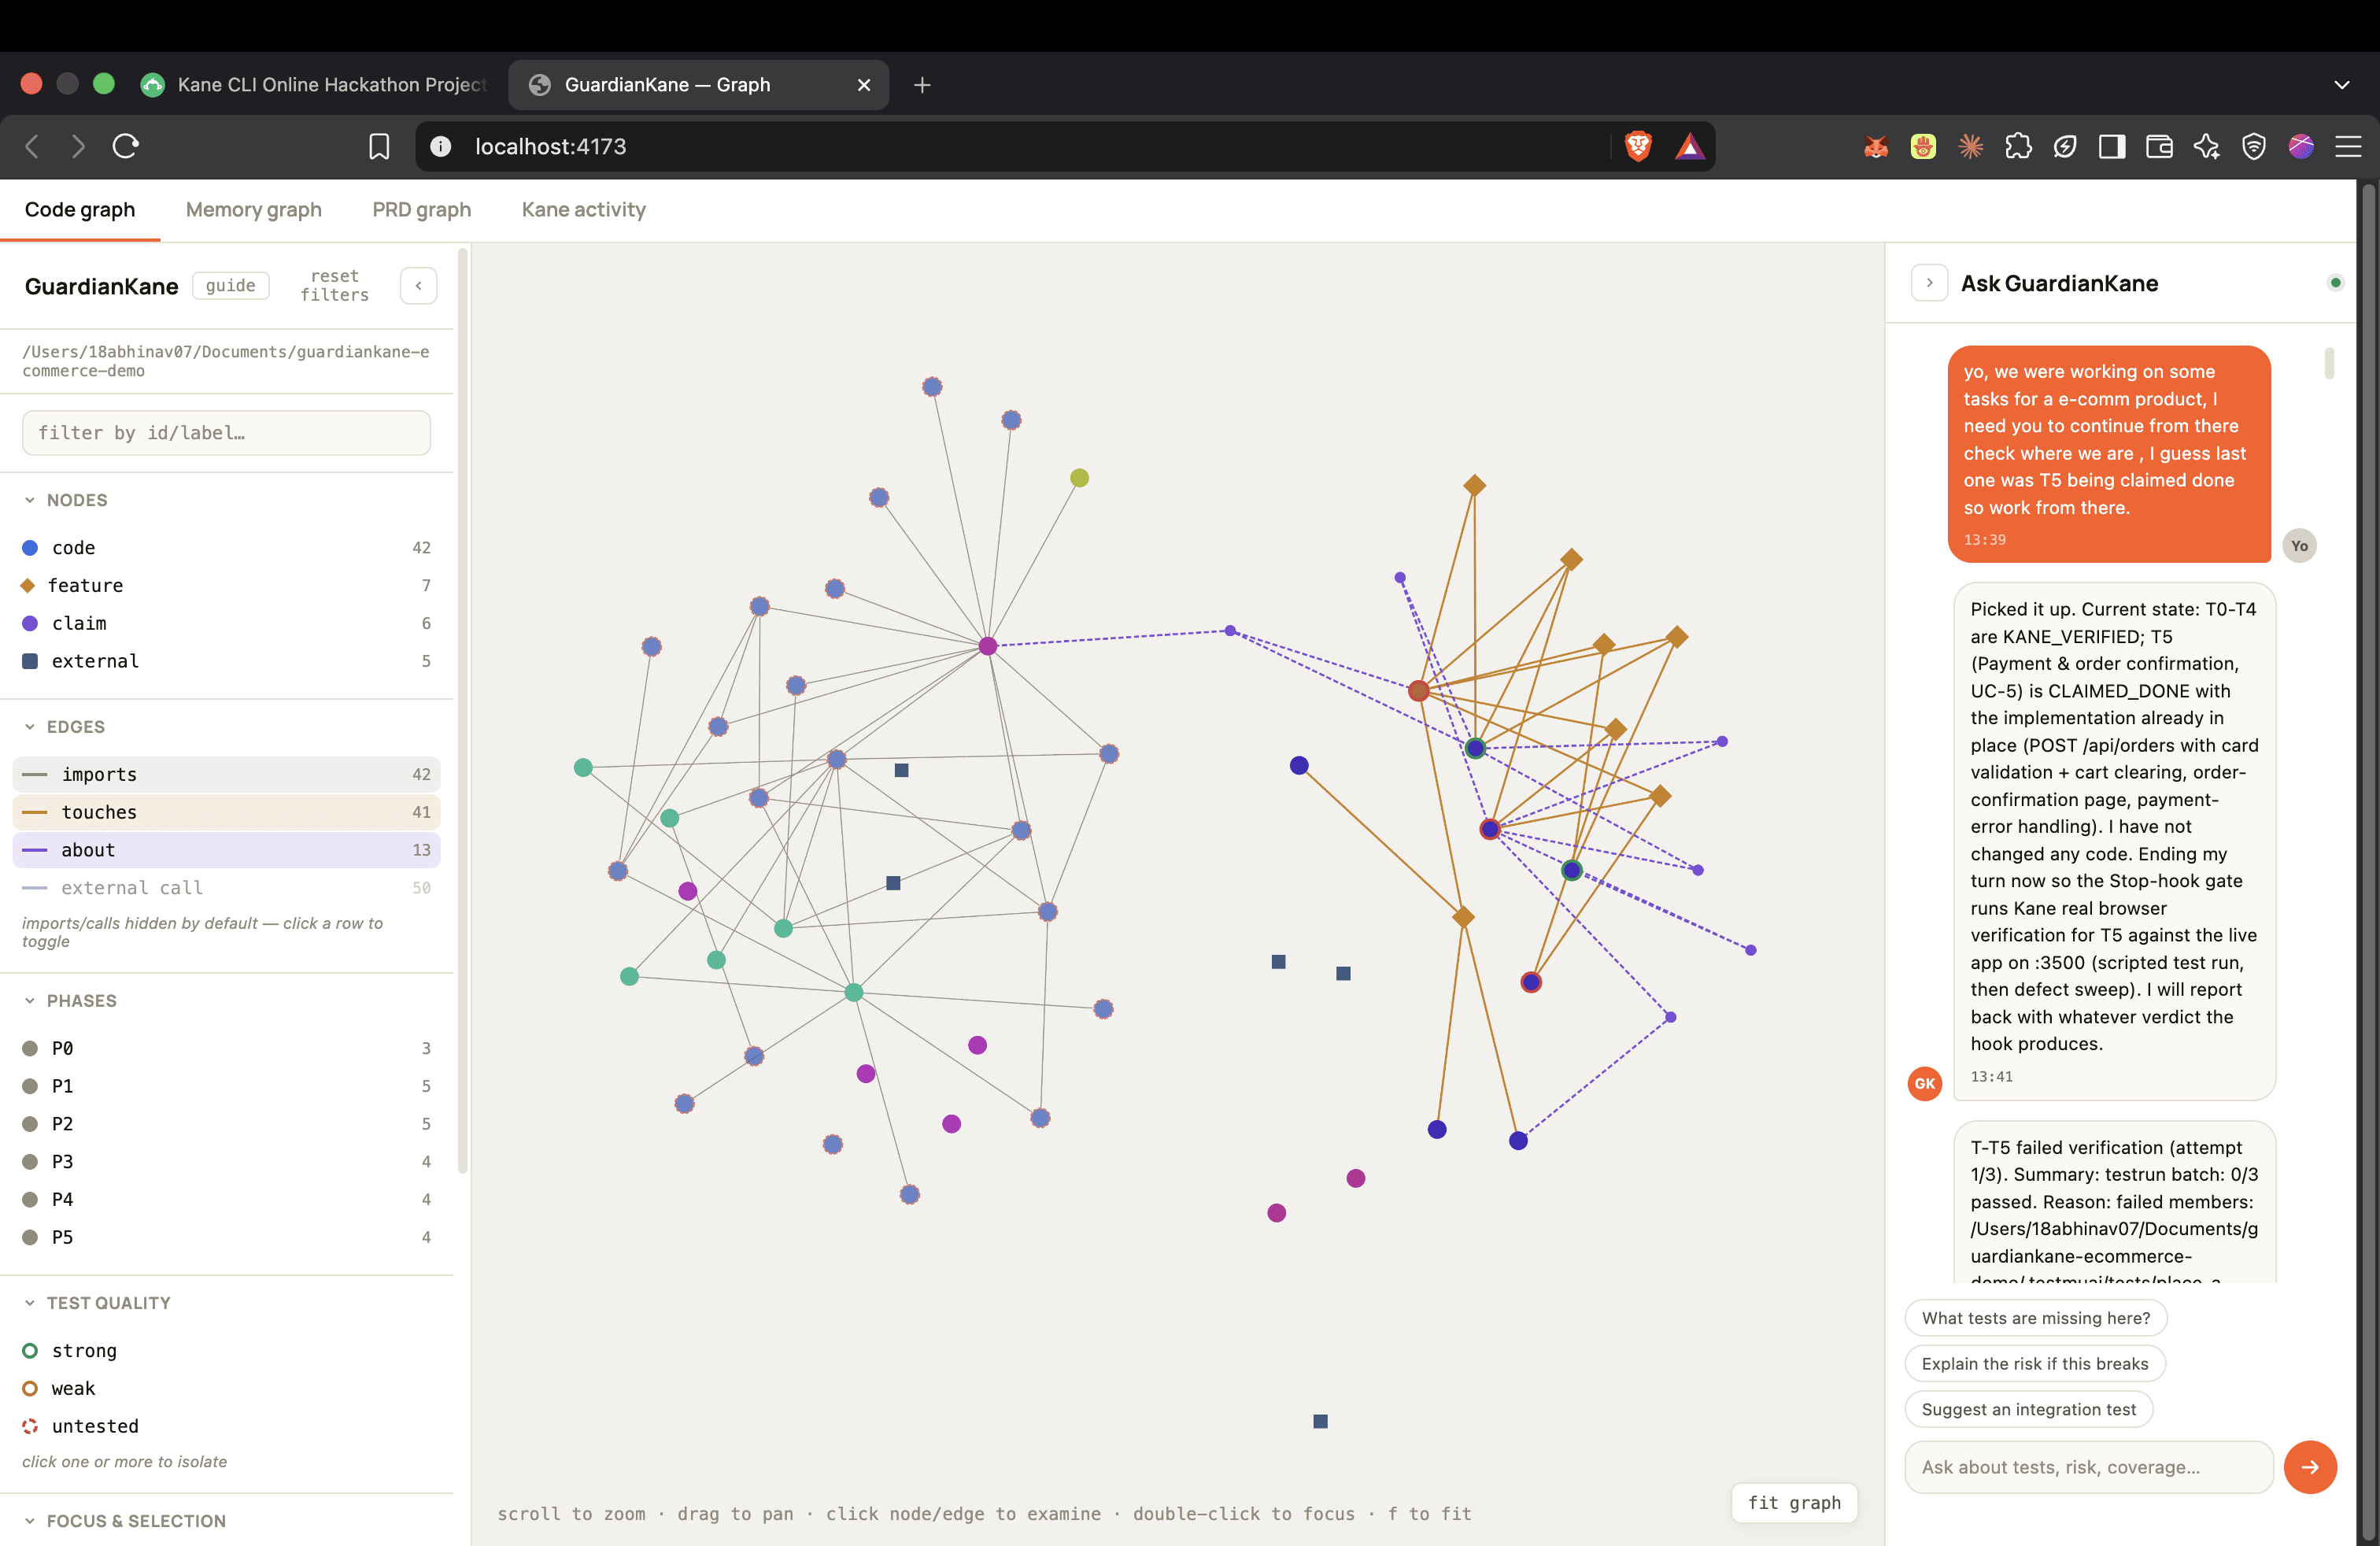
The v2 design spec defines three kinds of node and four kinds of edge:
- code nodes are files, from an import scan with
madge - feature nodes are tasks from the tracker
- claim nodes are Kane's use cases
- imports and calls connect code to code
- touches connects a task to every file the agent edited while working on it
- about connects a claim to the files it mentions
The legend on this screenshot counts 42 code nodes, 7 features, 6 claims, 42 import
edges, 41 touches, and 13 about edges. The touches edges are the dormant data from
Part 1: the PostToolUse hook had been recording them since the hackathon version and
nothing read them until this graph did. They are also the reason the graph is useful.
The orange cluster on the right is what the agent actually changed per task, drawn next
to what the PRD says those tasks are about.
Nodes carry a phase (P0 to P5 here) and a test-quality ring: strong, weak, or untested. Clicking one or more rings isolates them.
Focus and selection
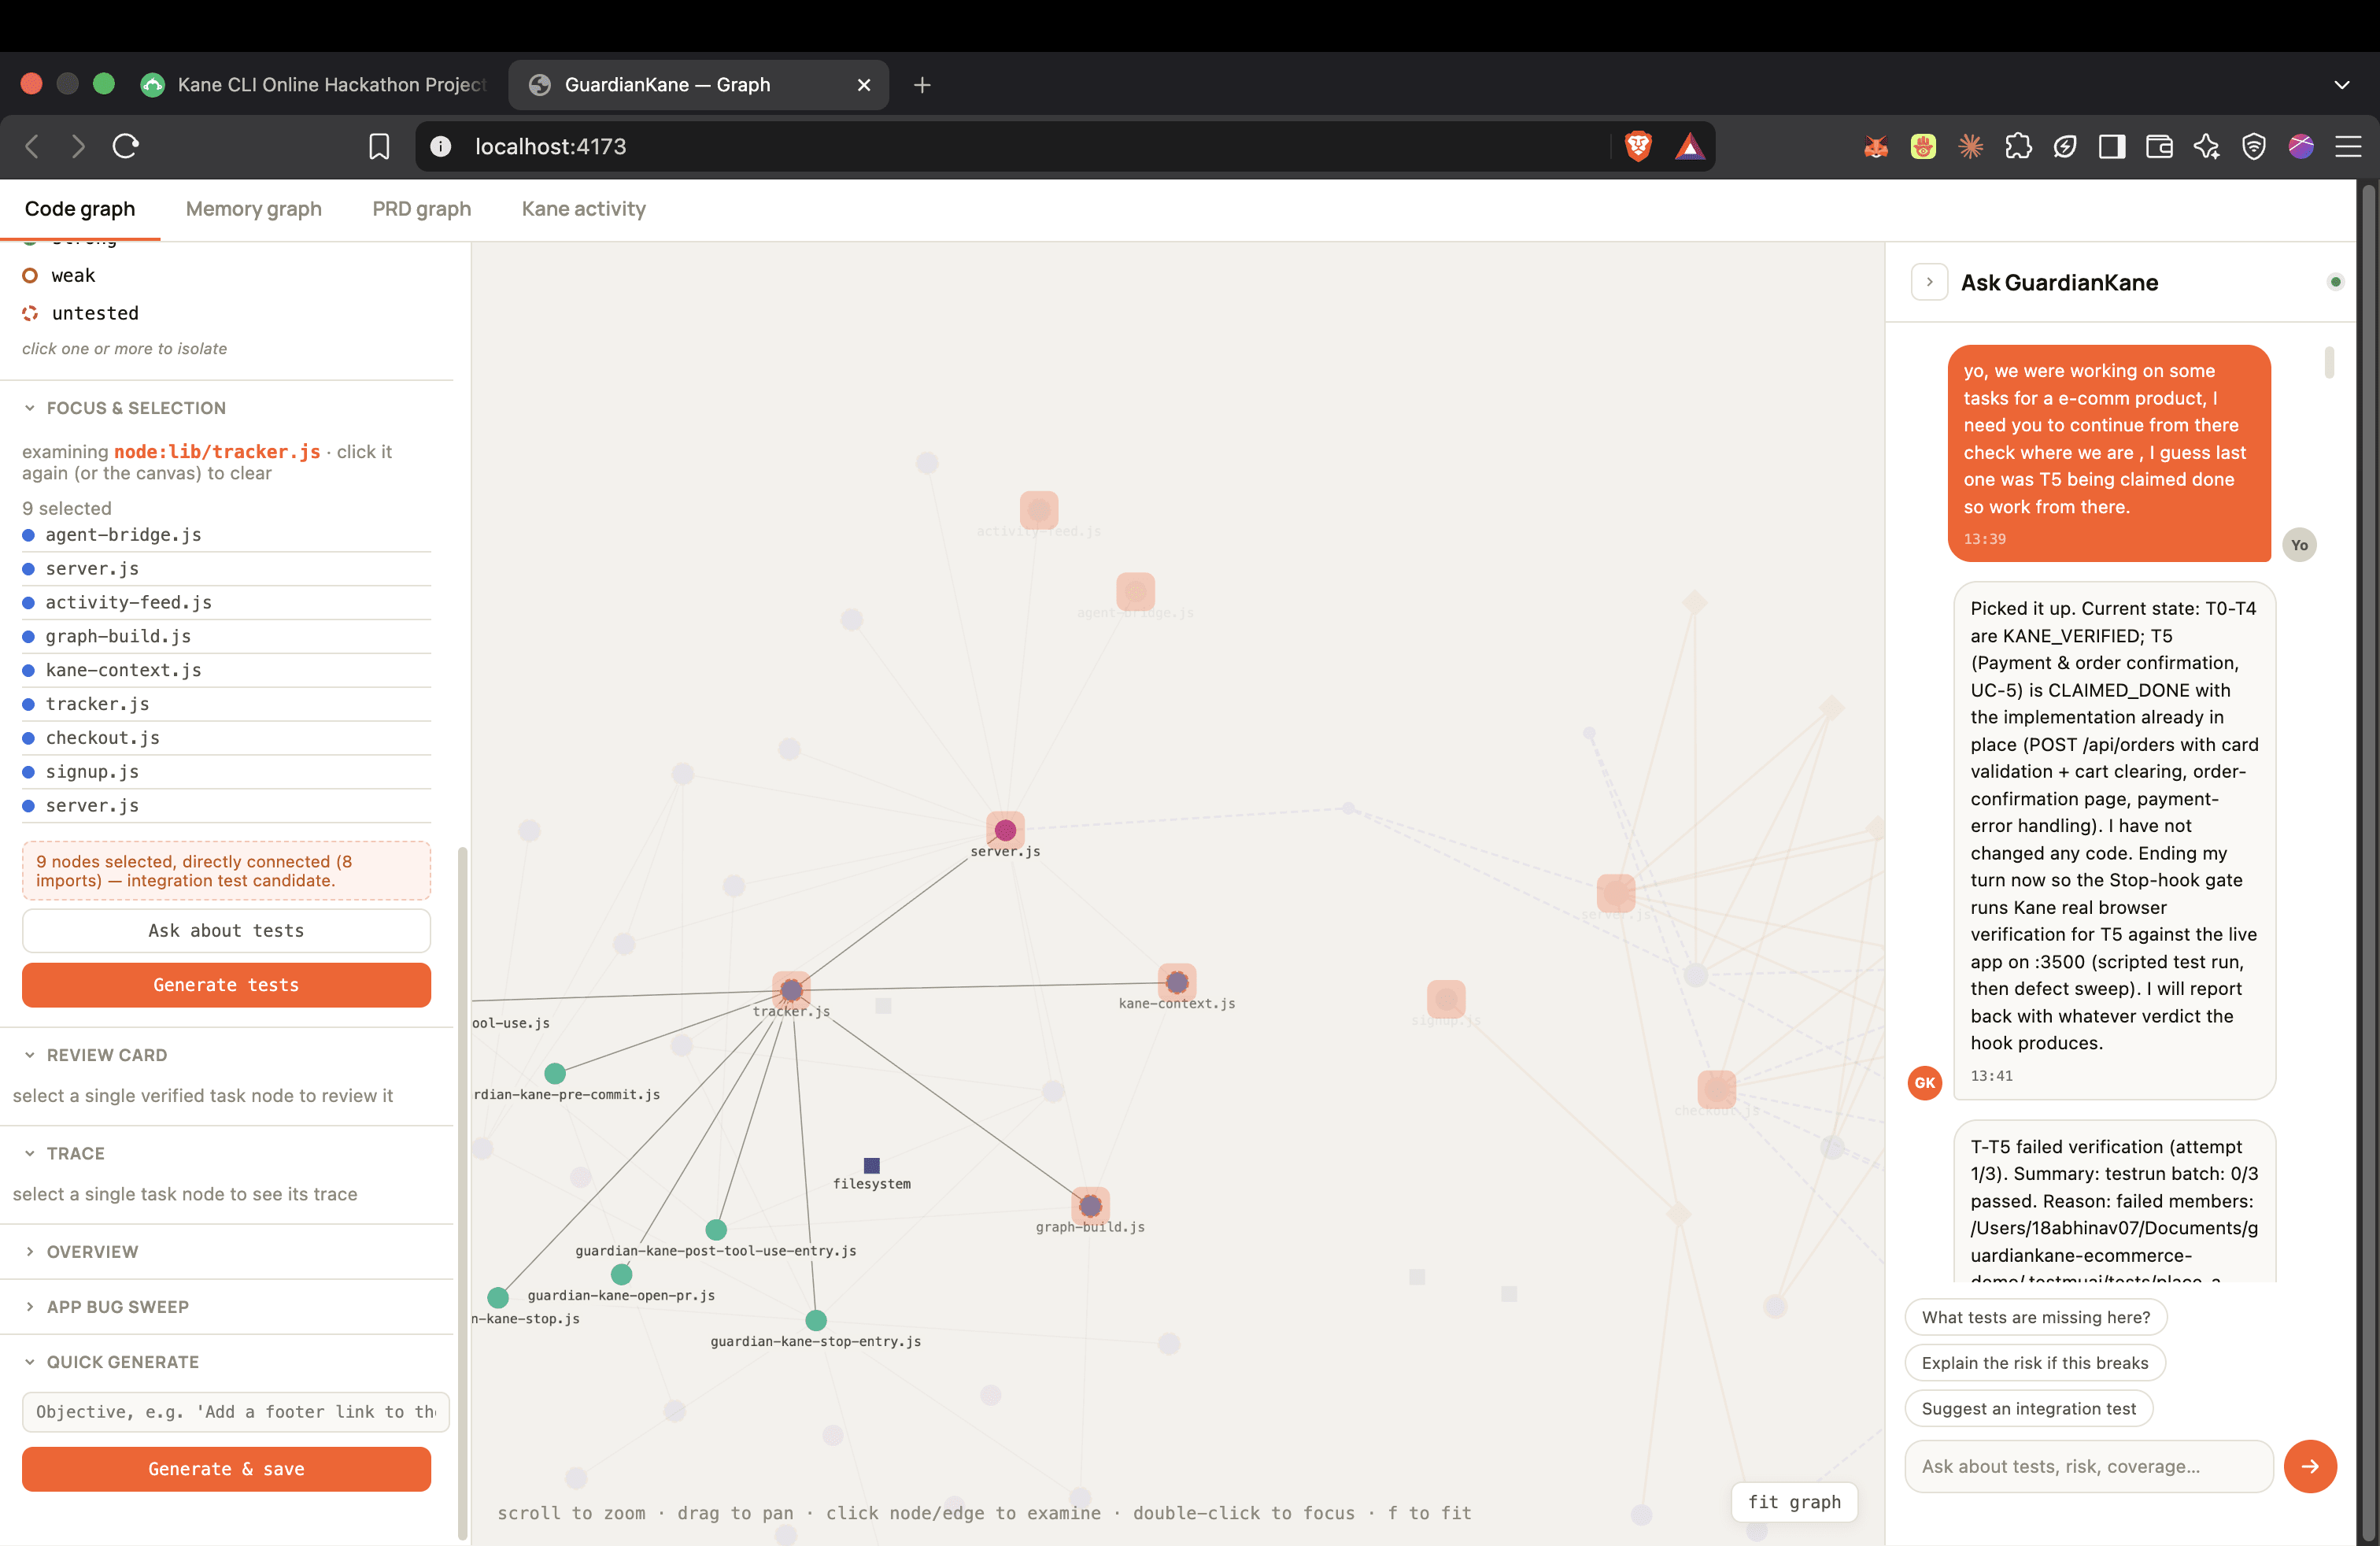
This is what "pull-based" from Part 1 looks like in practice. You select nodes; the sidebar tells you how they connect (here, nine nodes joined by eight imports, flagged as an integration test candidate); and "Generate tests" asks Kane for tests scoped to that selection instead of to the whole PRD. "Ask about tests" goes to Kane's recorded explanations. The same sidebar holds the review card, the trace for a selected task, an on-request whole-app bug sweep, and quick-generate.
One thing this screenshot shows that I did not intend: the selection includes
agent-bridge.js, graph-build.js, kane-context.js, and tracker.js. Those are
GuardianKane's own files. The installer copies them into the target project, and the
graph scans the project, so the tool shows up in the graph of the app it is checking.
The graph build takes an --exclude flag, but nothing excludes the installed files by
default. That default is the fix.
PRD graph
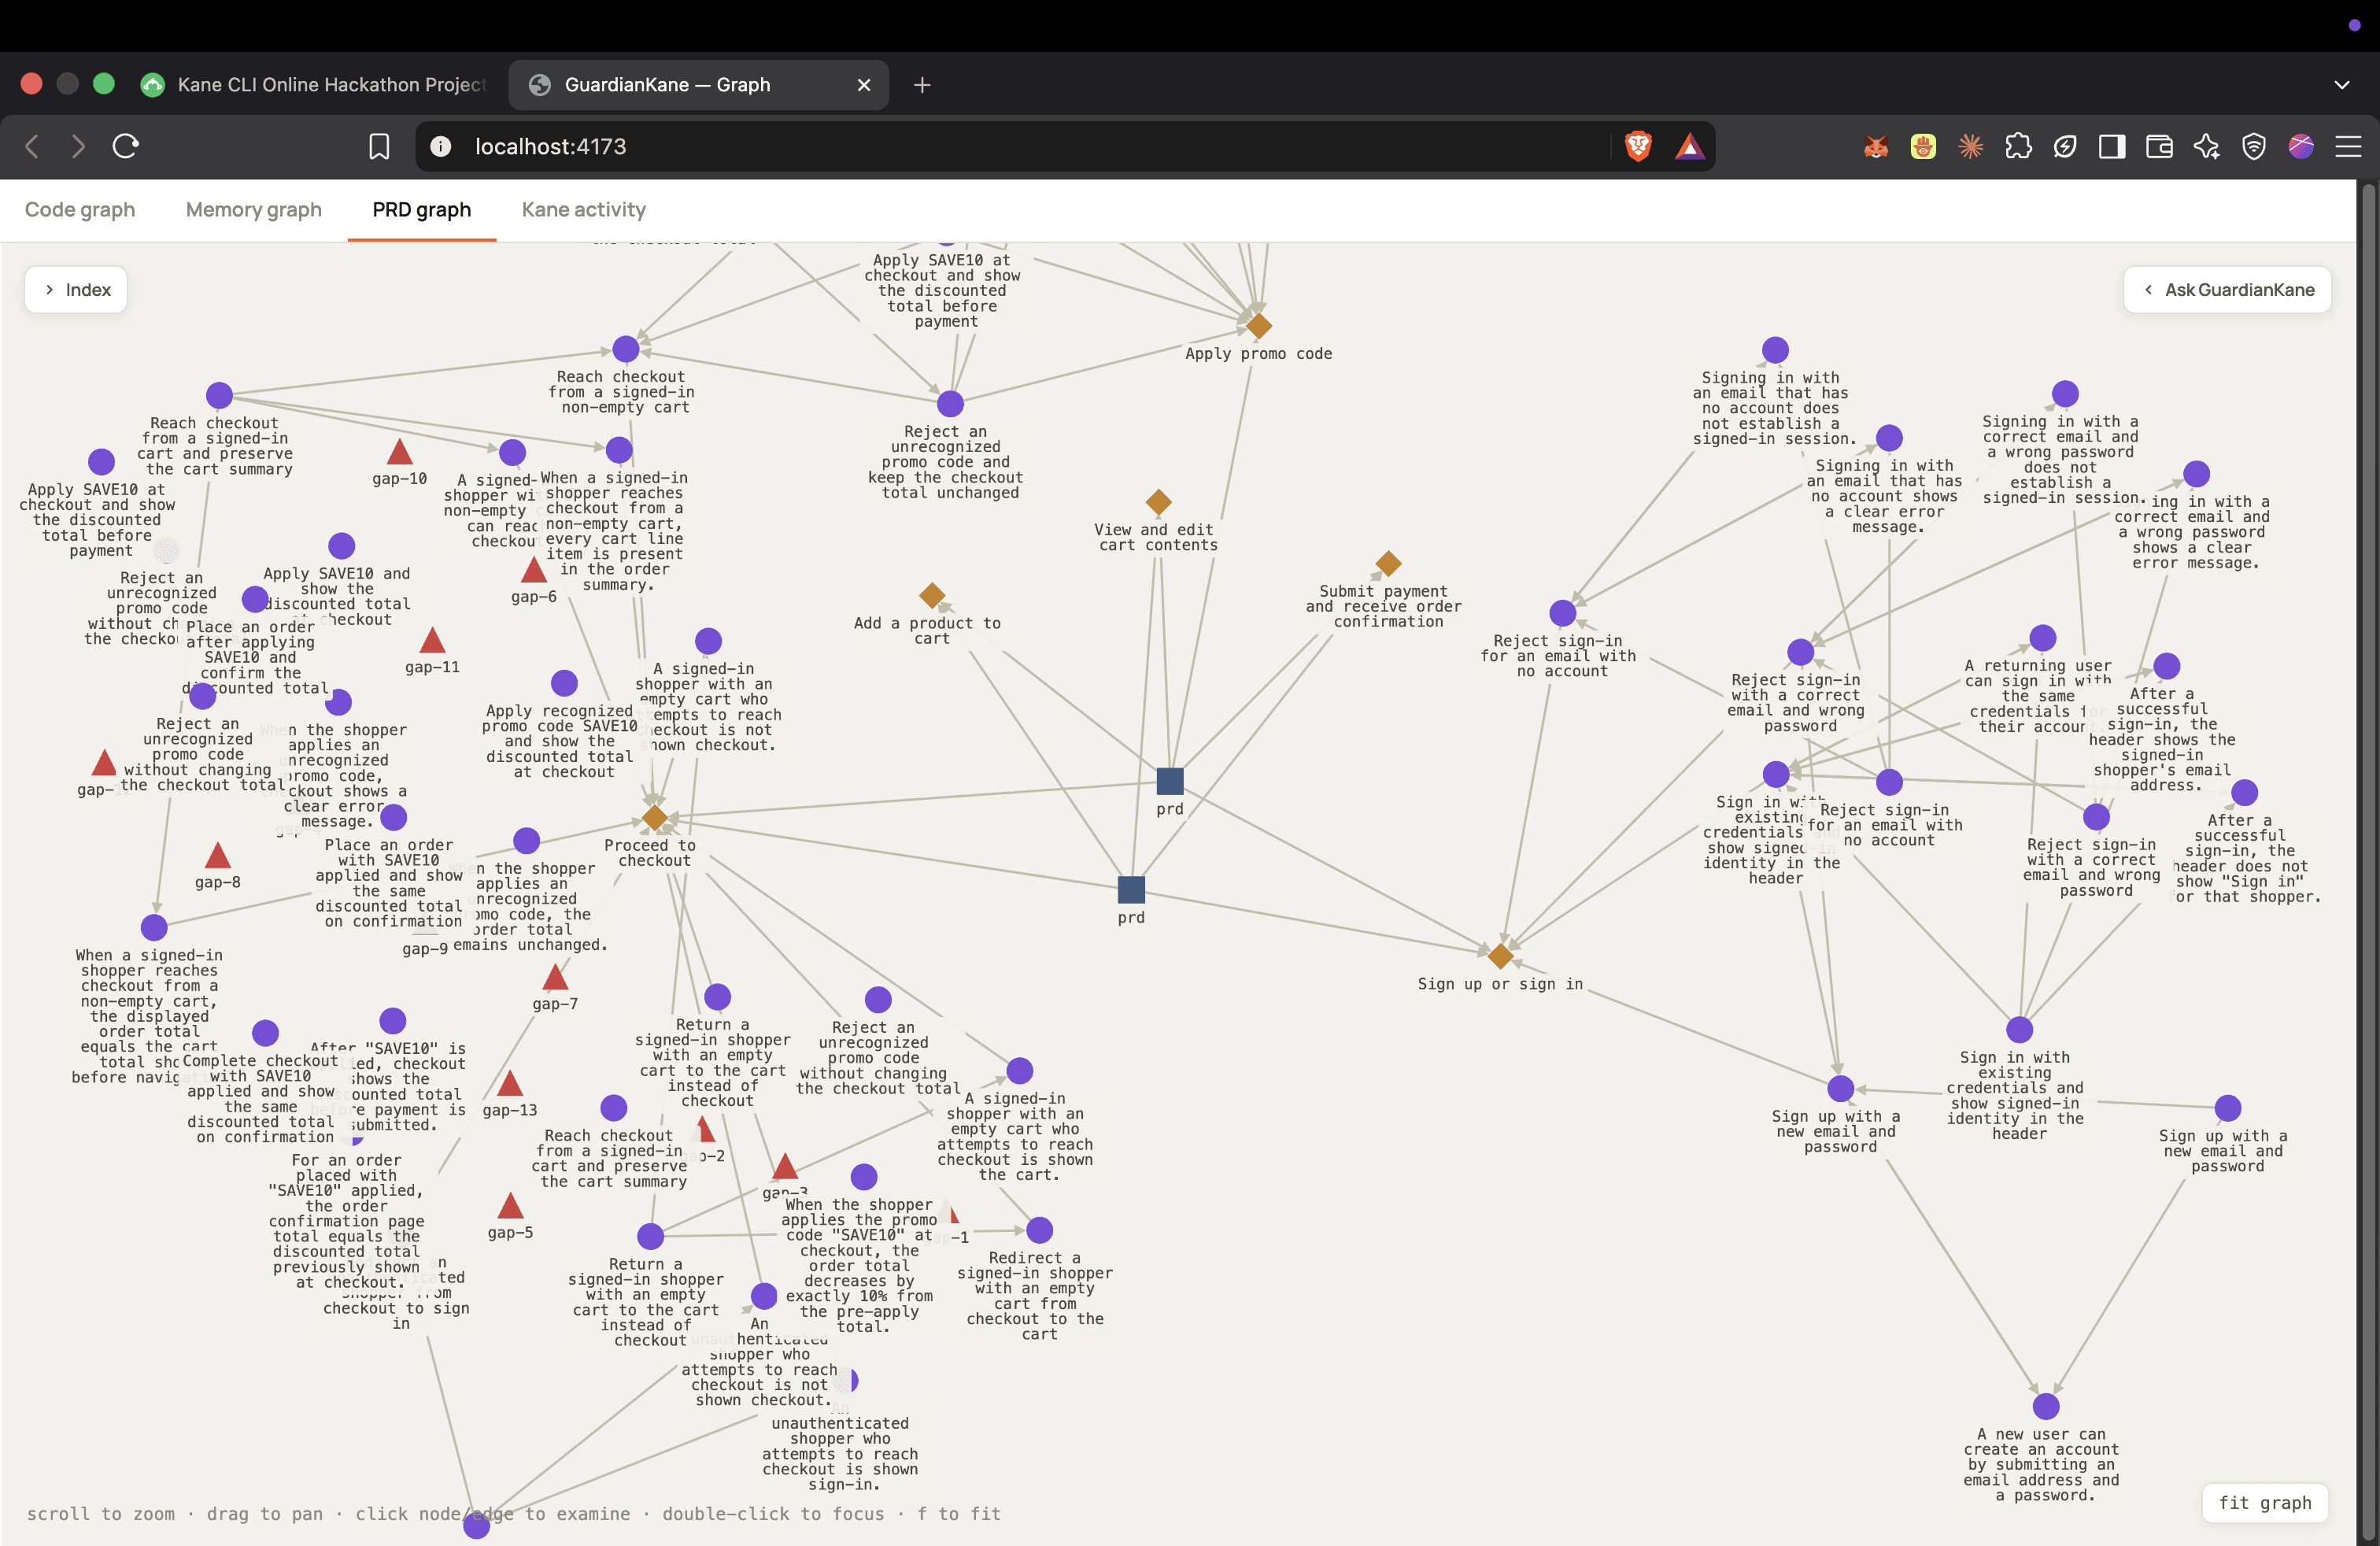
The PRD graph is Kane's claim graph for the project: every acceptance criterion as a node, grouped under the feature it belongs to, and every gap as a red marker. With the Gaps and drift panel open, the same tab shows the number I think matters most in the whole dashboard:
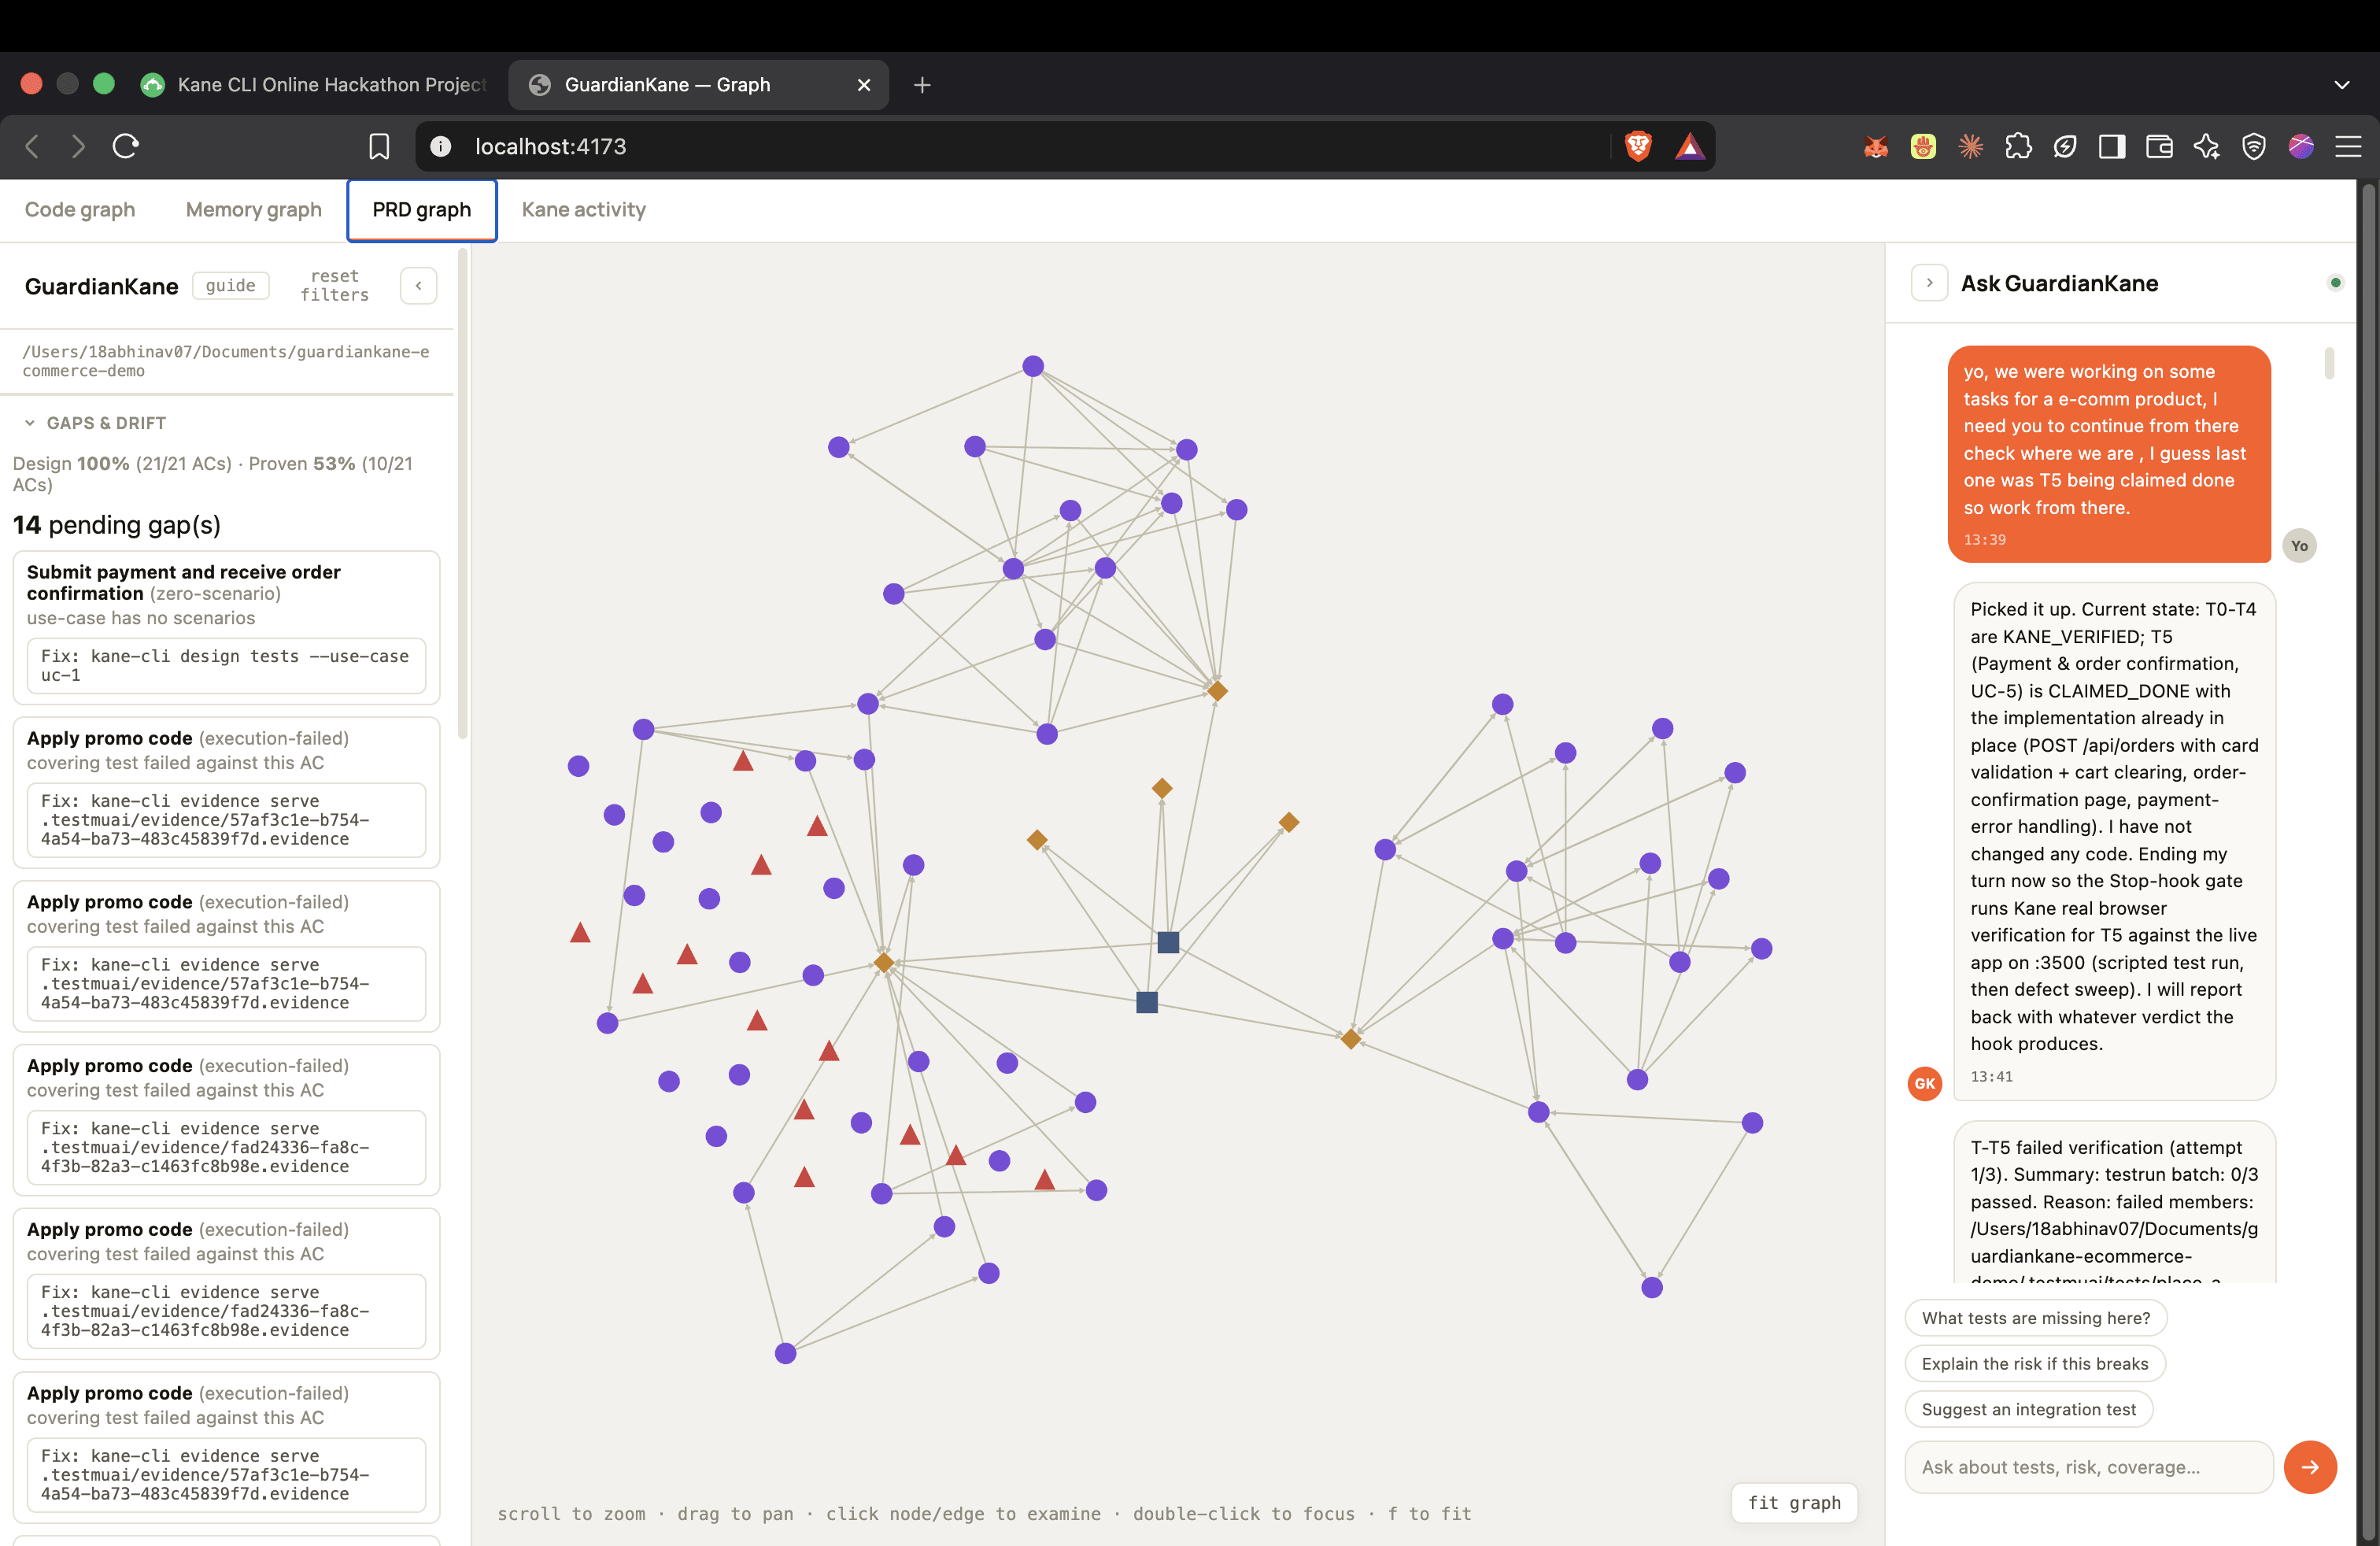
Design 100% (21/21 ACs). Proven 53% (10/21 ACs). Every acceptance criterion has a
test designed for it. Just over half have a test that has actually passed in a
browser. Those two numbers are the difference this whole project is about. The gate is
there to make the second one move, and the panel keeps the gap visible: 14 pending
gaps, each with the Kane command that would close it. This panel exists because of
Phase 5, which found that kane-cli cover gaps --json already computed all of it and
nothing called it.
A project that reports only the first number is reporting what it intends, not what it has.
Memory graph
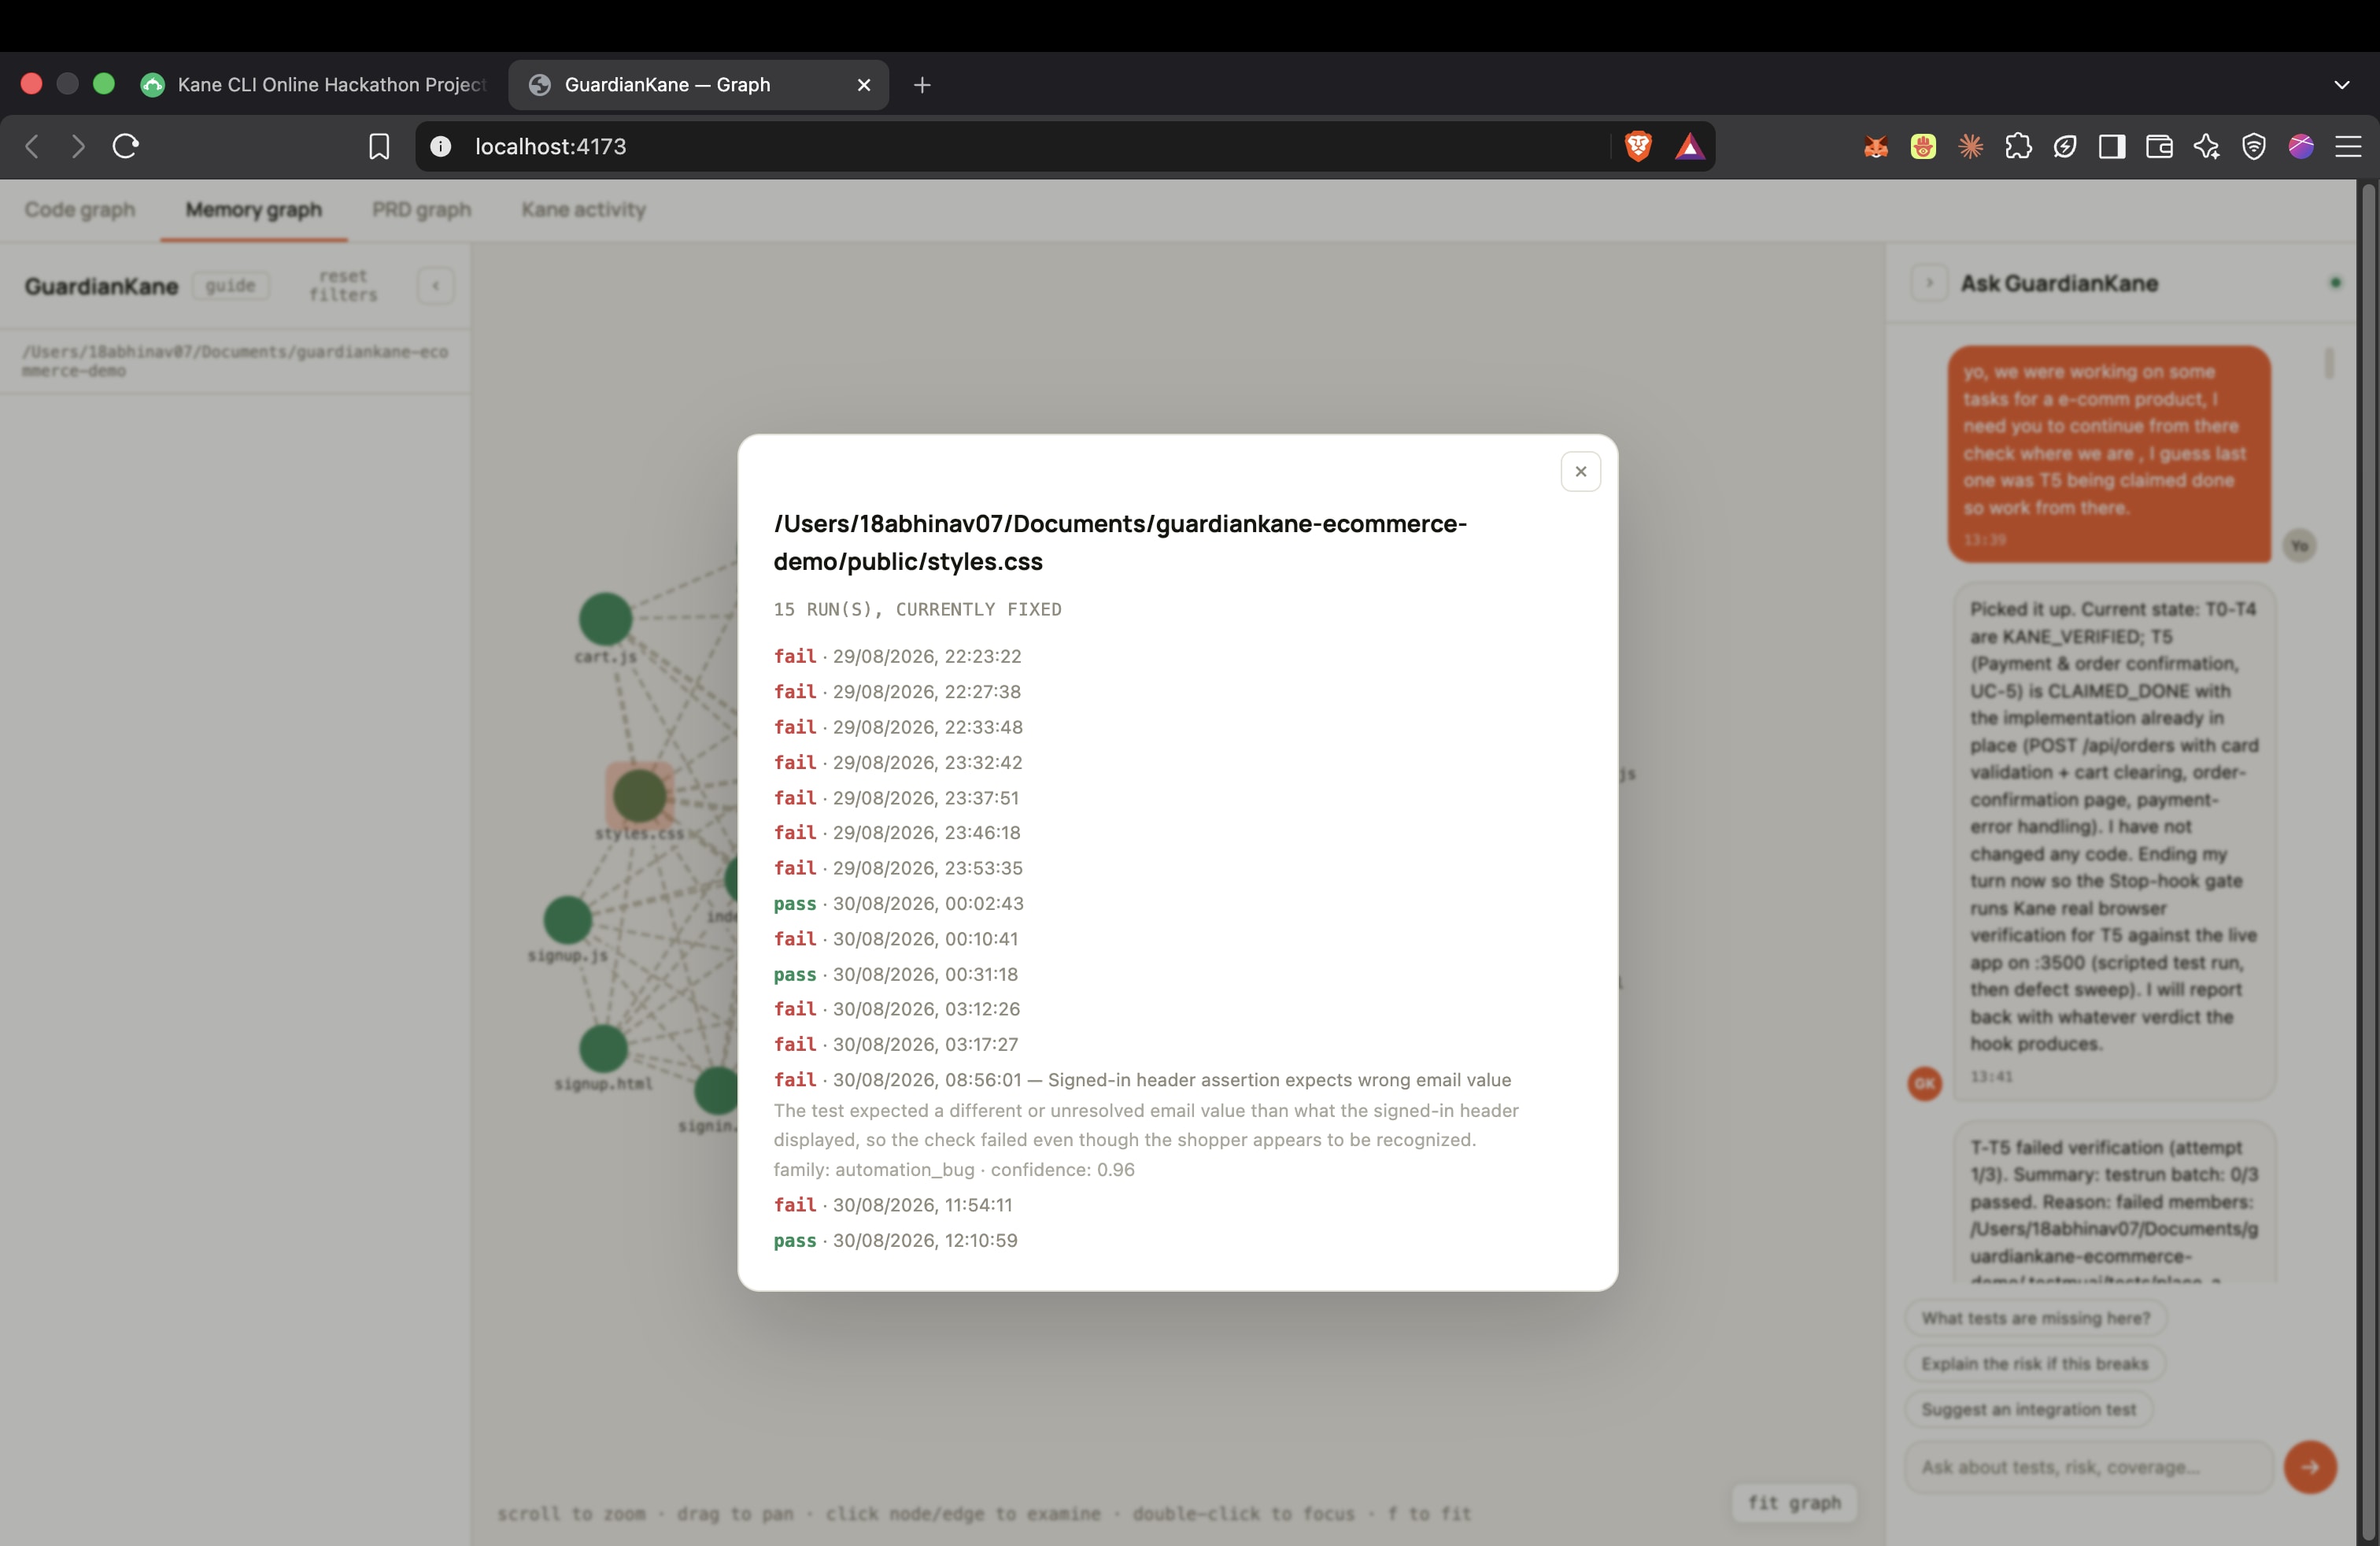
The memory graph renders knowledge memory: run history keyed by the set of files a verification touched, pass or fail, with timeouts and infra errors left out. This is the "memory of where" that Part 1 says the hackathon version lacked.
It needs reading with care. styles.css shows 15 runs, 12 fails and 3 passes, and
"currently fixed". Those are not 12 failures of a stylesheet. A stylesheet is touched
by nearly every verification, so its history is a record of the tasks that went
through it. And the one annotated failure is automation_bug at 0.96 confidence: the
test expected the wrong email, not the app showing it. The family is stored, so the
information to tell app bugs from test bugs is there. Nothing filters on it yet.
Kane activity
The Kane activity tab is kane-activity.log rendered newest first, with one colour per
outcome.
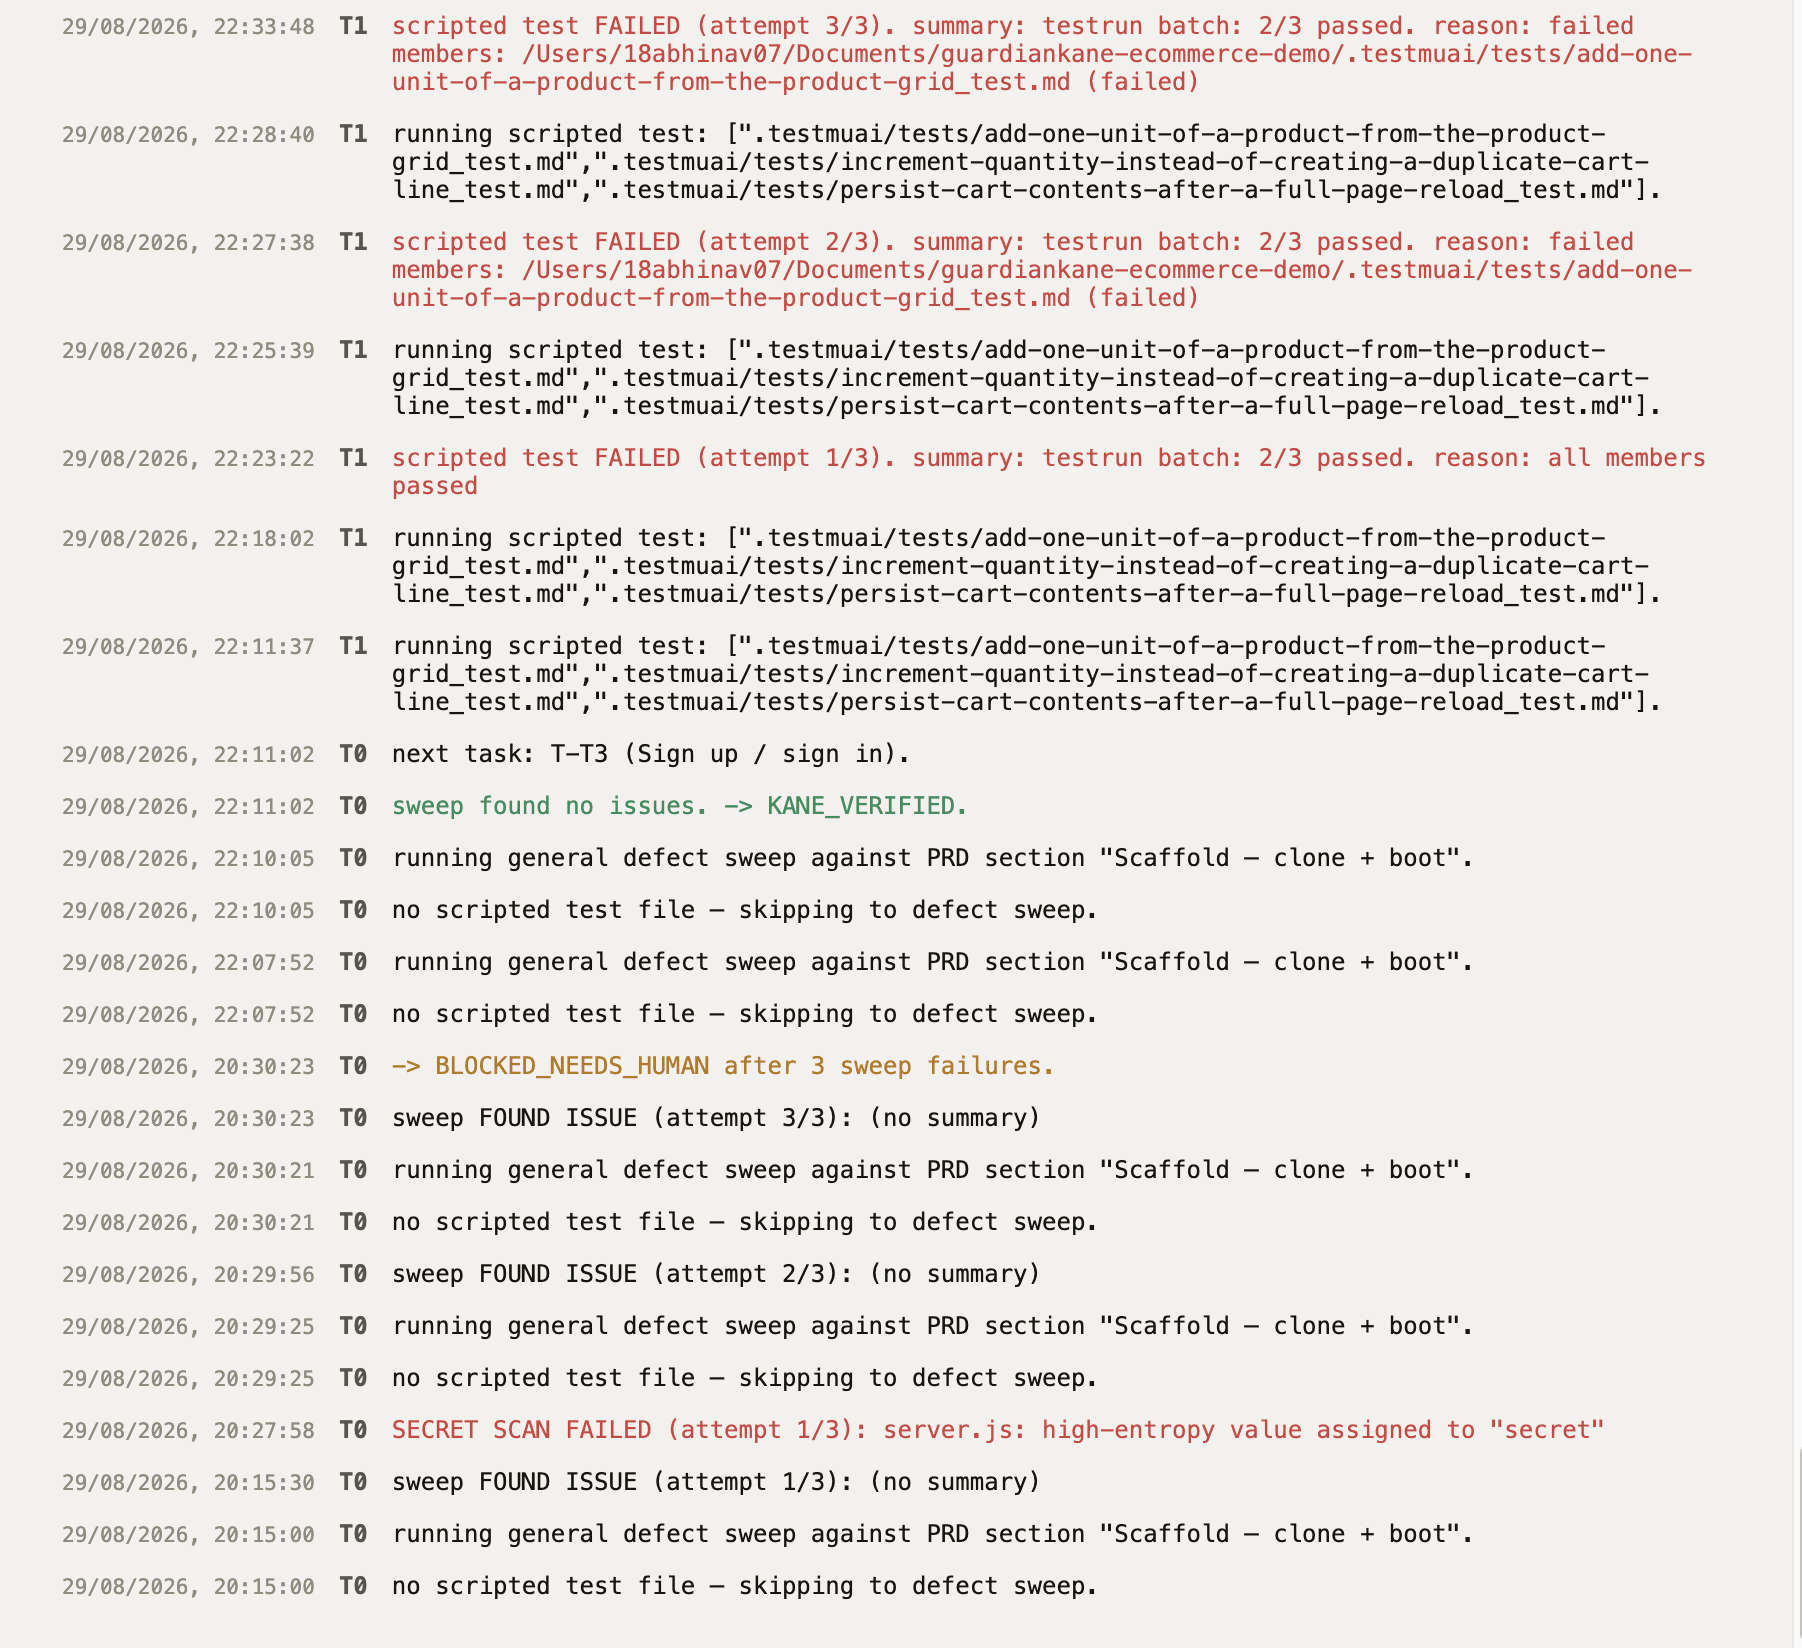
Its first version had the colours wrong: the classifier checked for "passed"
before "failed", so a line like "FAILED ... 2/3 passed", which appears below, rendered
as a pass. That was fixed in 86b3d09, from a dogfooding pass.
The chat is wired into the live session
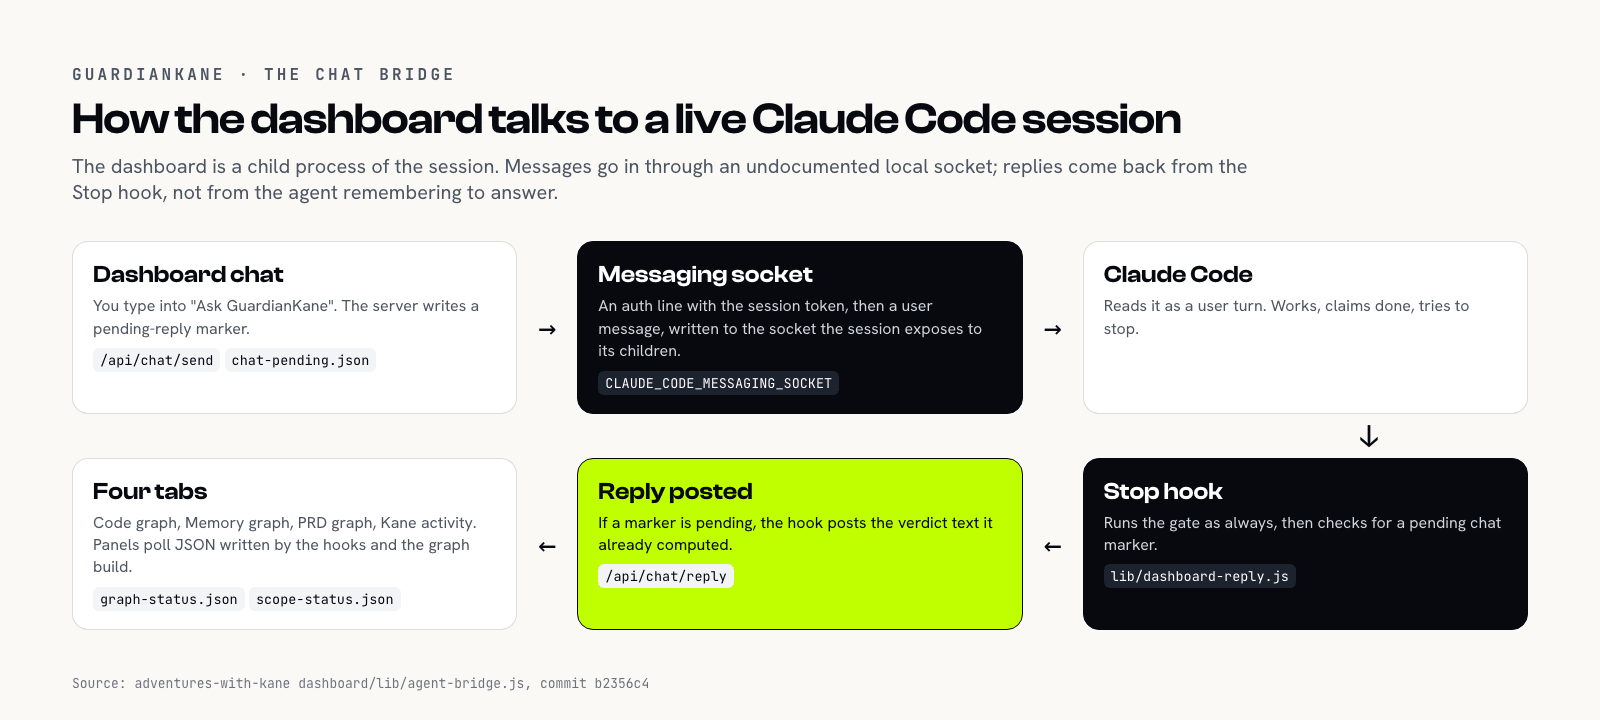
"Ask GuardianKane" is not a separate chatbot. A message typed there lands in the
Claude Code session that is building the app, as a user turn. The code that does it is
about fifteen lines in dashboard/lib/agent-bridge.js: connect to the Unix socket named
in CLAUDE_CODE_MESSAGING_SOCKET, write an auth line with the session's token, write the
message. The comment above it is blunt about where that came from: the protocol was
"reverse-engineered from strings embedded in the claude CLI binary itself; it is not
documented anywhere public". The dashboard has to be launched as a child of the
session to inherit the socket and token.
That makes it fragile in a way I want to be upfront about. It depends on an undocumented interface that could change in any Claude Code release, and I have no guarantee it will keep working.
The first version also had a problem that was obvious once anyone used it: messages
went in and nothing came back. The chat relied on the agent remembering to post a
reply to the dashboard, and it did not. Commit b2356c4 moved the reply out of the
agent's hands. Sending a message now writes a chat-pending.json marker; the Stop hook,
which runs at the end of every turn anyway, checks for the marker and posts back the
verdict text it already computed. In the code graph screenshot above, the last chat
bubble ("T-T5 failed verification (attempt 1/3) ...") is in the Stop hook's own denial
format, which is the text the auto-reply posts. The agent did not write it. The gate
did.
It is the same move as the rest of the project. Do not rely on the agent to report on itself; have the thing that checks it do the reporting.
What the demo's log says about the gate
The dashboard earned its keep by showing me bugs in GuardianKane, not just in the app.
The ecommerce demo's committed kane-activity.log is 103 lines, and some of its lines
are wrong about themselves.
"FAILED ... reason: all members passed". T1's first batch, on August 29:
[T1] scripted test FAILED (attempt 1/3). summary: testrun batch: 2/3 passed. reason: all members passedT2 has the same shape at 3/4, and T5 at 0/3. Commit a6a6dc1 (August 30) traced two
causes in the runner. A batch killed mid-flight fell through to a reason that claimed
every member passed. And kane-cli's process exit code can be non-zero on a full pass:
the commit records a live run that "exited 1 with status: 'passed'", which had produced
a false KANE_FAILED. The fix trusts Kane's structured verdict over the exit code.
The commit is timestamped 12:16 IST; T5's contradictory line is at 14:17 IST the same
day. The installer copies the hooks into the project, and I do not have data on which
version the demo was running at that moment.
"AC EVIDENCE CHECK FAILED" after a 3/3 pass. Later on the 29th, T1's batch passed
3/3 and was still failed by the per-AC evidence check, three times in a row, with "no
evidence pack path reported" and then "no matching evidence pack found". Commit
9181821 found the gate matching evidence on the wrong field. Kane's result.yaml has
a definition_id, the content hash in the test's frontmatter. The check looked for an
assurance_id, which the batch output did not contain, so it "silently failed the
evidence check on every batched task". The commit message names T1's failures as the
case it matches. For those three strikes, the app was fine and the checker was wrong.
"all tasks KANE_VERIFIED. Build complete." At 19:01 UTC on the 29th, after T2 was verified, the log says the build is complete. The next line starts T3's tests, and T4 and T5 follow the next day. I do not have data on what the tracker held at that moment; the log alone shows the gate declaring done while work was still being verified.
"FAILED ... reason: Objective completed". After T3's tests were rewritten, its first run on the new files is logged as a failure whose summary describes a successful sign-up and whose reason is "Objective completed". I do not have data on why that run was classified as a failure; it is not one of the cases the commits above describe.
The rest of the log is the loop working as designed. T3 reaches three failures, the
last with assertion_failed: @ step 3, escalates to a human, and after its tests were
rewritten goes on to pass and verify. T4 goes 0/3, 1/3, 3/3, then verified. T5 runs into
three kane-cli timeouts (exit null, state unchanged, no strike charged), then three
counted failures: the first is the "all members passed" contradiction above, and the
last two are on the reject-invalid-card-details test. It ends the committed log at
BLOCKED_NEEDS_HUMAN. The chat in the code graph screenshot, taken on August 31, shows
T5 picked up again after that.
So the closed loop in the demo is real, and it is not tidy. Two of the escalations in its history were at least partly the gate's own bugs. That is the lesson of who verifies the verifier again, and the reason the dashboard renders the raw log instead of a summary of it.
The dashboard had its own bugs too
One more, because it is the kind a verification tool should be embarrassed by. Task
titles, verdict summaries, AC references, and log lines were written into the page with
innerHTML unescaped in three renderers: the review card, the trace panel, and the
stuck-tasks panel. Commit 1c9f476 calls it what it was, a stored XSS through
server-controlled fields, and escapes them. Some of those fields come from Kane's
output and some come from the agent, so "server-controlled" here means "written by
software I do not fully control".
The same dogfooding pass (86b3d09) fixed a "show N more" toggle on the drift list that
never worked because of an inverted boolean, and started reaping orphaned Chrome
processes that kane-cli's runs left behind.
What visible buys you
A pass or fail line tells you whether to keep going. The dashboard answers the questions that come after it: what did the agent touch, which requirements are proven and which are only designed, which failures were the app and which were the checker, and what has been stuck since yesterday. None of that makes the agent more honest on its own. It makes it cheaper for a person to check, which in my experience is what decides whether anyone checks at all.
The full current build is in the demo video, the code is at github.com/18Abhinav07/adventures-with-kane, and the ecommerce demo with its history is at github.com/18Abhinav07/guardiankane-ecommerce-demo. GuardianKane is built on Kane CLI by TestMuAI.
Part 2 of 2. Previously: the second build was mostly wiring. The hackathon version, and the experiments behind it, are in Your agent might actually lie to you.
The loop that makes an agent's "done" something it has to prove, not just say.